![]()
![]()
|
|
Background Modules for ChE473K Process Design and Operations at the University of Texas at Austin Gerald G. McGlamery, Jr., Ph.D., P.E. |
![]()
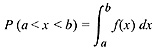
The Probability Density Function The Probability Density Function (PDF) expresses the probability of a continuous random variable (CRV) taking on a value between any two points in the range of that variable. The probability of an event occuring between any two values, a and b, of the CRV is given as where f(x) is the probability distribution function.
Probability is valid for a CRV on an interval only. In other words, the probability of any single value of x is zero. For example, if the possible values of the net present value (NPV) of an investment in a new pump are distributed as a CRV, the probability of the NPV being exactly $1 million is zero. The probability of the NPV being between $0.9 million and $1.1 million, however, is some finite number greater than zero and can be determined from the PDF for the NPV of the pump investment. In a qualitative sense, the PDF does show the comparative distribution of the likelihood of x taking on a specific value. In the curve above, for example, you can clearly see by inspection that an outcome of zero is more likely than an outcome of +1 or –2. |
|||
|
|
|
|
|
![]()
|
Updated: |
All Material © 2001–2010
Gerald G. McGlamery, Jr. |